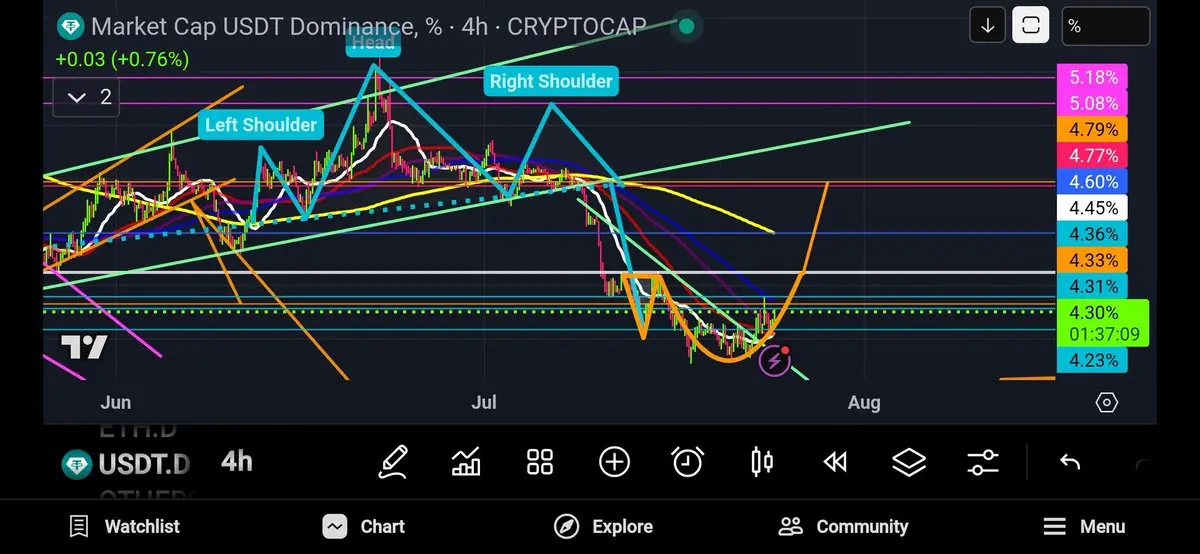
$USDT.D Stable Currency Dominance
4Hr Chart Analysis
Price action is below the 4Hr 200MA, which is bearish for Stable Currency Dominance.
However, we must consider that price action hasn't retested the yellow 4hr 200MA or the breakdown of the green bearflag.
Price action normally likes to retest for confirmation.
This orange Adam and Eve double bottom reversal formation could facilitate the retest of the breakdown.
This looks to be a likely senario. This could cause more red candles in the crypto market before the big gains that are on the horizon.
NFA, DYOR ⚠️
#Crypto # Trading #USDT